How to Export a HAR File from Chrome DevTools
A HAR (HTTP Archive) file is a JSON-formatted log of all network requests your browser made while loading a webpage. It's the most reliable way to audit which marketing tags, pixels, and analytics scripts are actually firing — not just what's installed, but what ran, when, and with what data.
Open the page you want to audit
Navigate to the specific URL you want to analyze in Google Chrome. This works best on product pages, checkout pages, or landing pages where most marketing tags fire. For best results, use an Incognito window to avoid cached data interfering with the results.
Open Chrome DevTools
Press F12 on Windows/Linux, or Cmd + Option + I on Mac. Alternatively, right-click anywhere on the page and select "Inspect". The DevTools panel will open — it's the same powerful tool professional developers use daily.
Go to the Network tab
Click on the "Network" tab at the top of the DevTools panel. If you don't see it, click the » overflow arrow to find it. Make sure "Preserve log" is checked so requests aren't cleared on navigation.
Reload the page to capture all requests
Press Ctrl + R (or Cmd + R on Mac) to reload the page with the Network tab open. Watch all the network requests populate the list in real time. You can see every pixel, API call, and script that fires — exactly what HAR Tag Inspector will analyze for you.
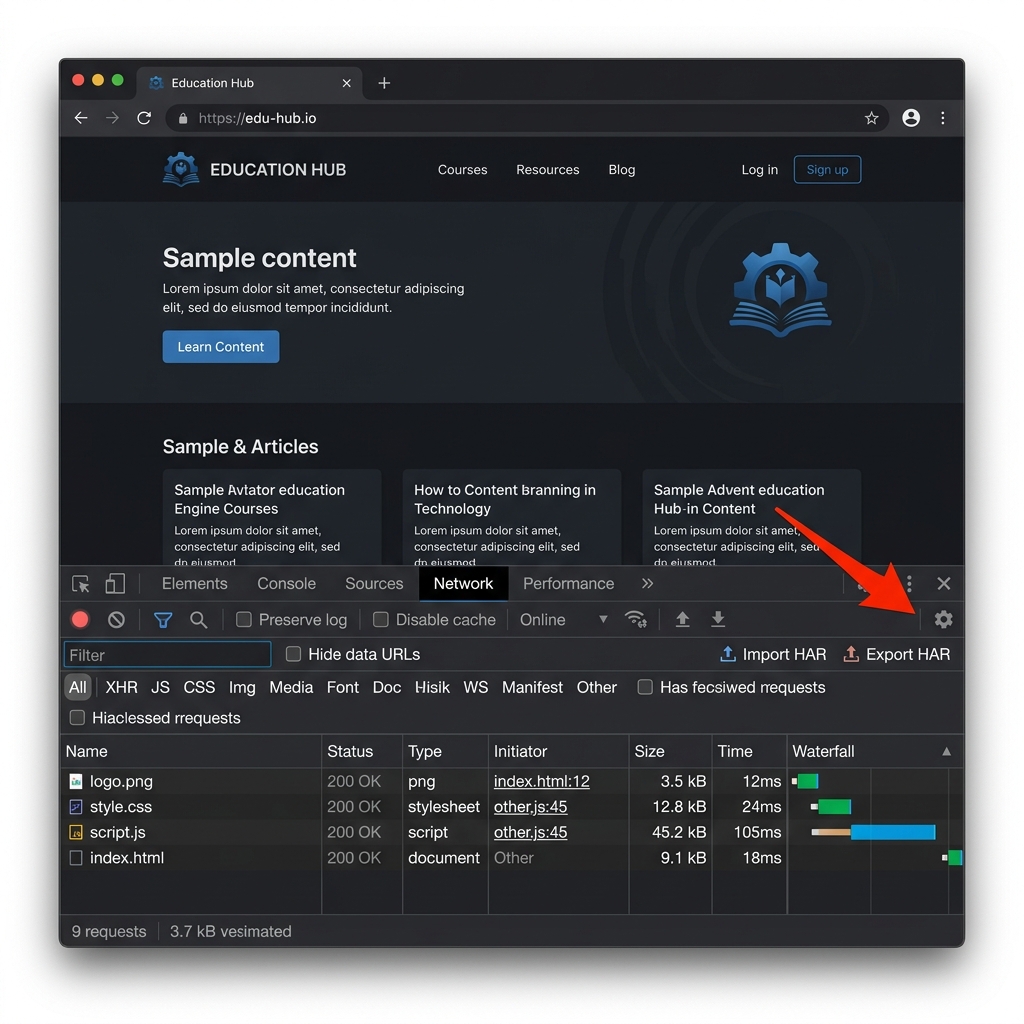
The red arrow points to the Export HAR download icon in the Network toolbar.
Click the Download / Export HAR button
Look at the Network toolbar for a download icon ⬇ (it looks like an arrow pointing down into a tray). Click it. A "Save As" dialog will appear. Save the file anywhere on your computer — it will have a .har extension. The file size is typically between 1 MB and 50 MB depending on how many requests the page made.
Drop the file into HAR Tag Inspector above
Go back to the top of this page and drag the .har file you just saved directly into the drop zone, or click "Browse File" to select it. The tool will parse the file in under a second and show you every marketing platform that fired, organized in a clean sidebar — click any platform to inspect individual requests, headers, and payloads.
What Marketing Tags Can HAR Tag Inspector Detect?
HAR Tag Inspector uses an advanced pattern-matching engine with regex-based rules to identify over 35 different marketing platforms from a single HAR file. Unlike browser extensions that only work in real time, this tool lets you analyze any recorded session, share HAR files with your team, and audit pages you can't visit directly.
Frequently Asked Questions
Is my HAR file data safe? Does it get uploaded to a server?
Completely safe. HAR Tag Inspector processes your file 100% in the browser using JavaScript. Your HAR file is never sent to any server, never stored, and never leaves your computer. This is a client-side only tool — refresh the page and everything is gone.
Why can't I see GA4 events in the filter even though they're firing?
This often happens when the site uses server-side Google Tag Manager (sGTM). Instead of sending data directly to google-analytics.com, the request goes to a custom domain (e.g., stm.yoursite.com/g/collect). HAR Tag Inspector detects this pattern — look for any URL containing /g/collect regardless of the domain.
What's the difference between a HAR file and using GA4 DebugView?
DebugView only shows events recognized by Google Analytics. A HAR file shows every network request — including failed requests, requests with wrong measurement IDs, consent-blocked calls, and third-party pixels your GA4 doesn't know about. It's a much more complete picture of what's happening on the page.
Can I use this to audit a website I don't own?
Yes. Simply visit any public URL in Chrome, record the HAR file as described above, and analyze it. This is a legitimate and widely-used technique for competitive research, agency audits, and GTM implementation reviews. Many digital marketing professionals use this to verify that tracking is working correctly on client sites.
Why does my HAR file show requests under "Other" instead of a named platform?
Either the platform isn't in our database yet, or it's using a non-standard endpoint. Common examples: custom server-side proxies, first-party data collection APIs, or newer platforms we haven't added yet. You can still inspect every request in the "Other" category — all headers and payloads are fully readable.
Does this work with Firefox or Safari HAR files?
Yes. While the steps above are for Chrome, Firefox and Safari also support HAR export. In Firefox: DevTools → Network → right-click → "Save All As HAR". In Safari: Develop → Show Web Inspector → Network → Export. The HAR format is a standard and HAR Tag Inspector supports all browsers.